P R O J E C T
Datascape
#1
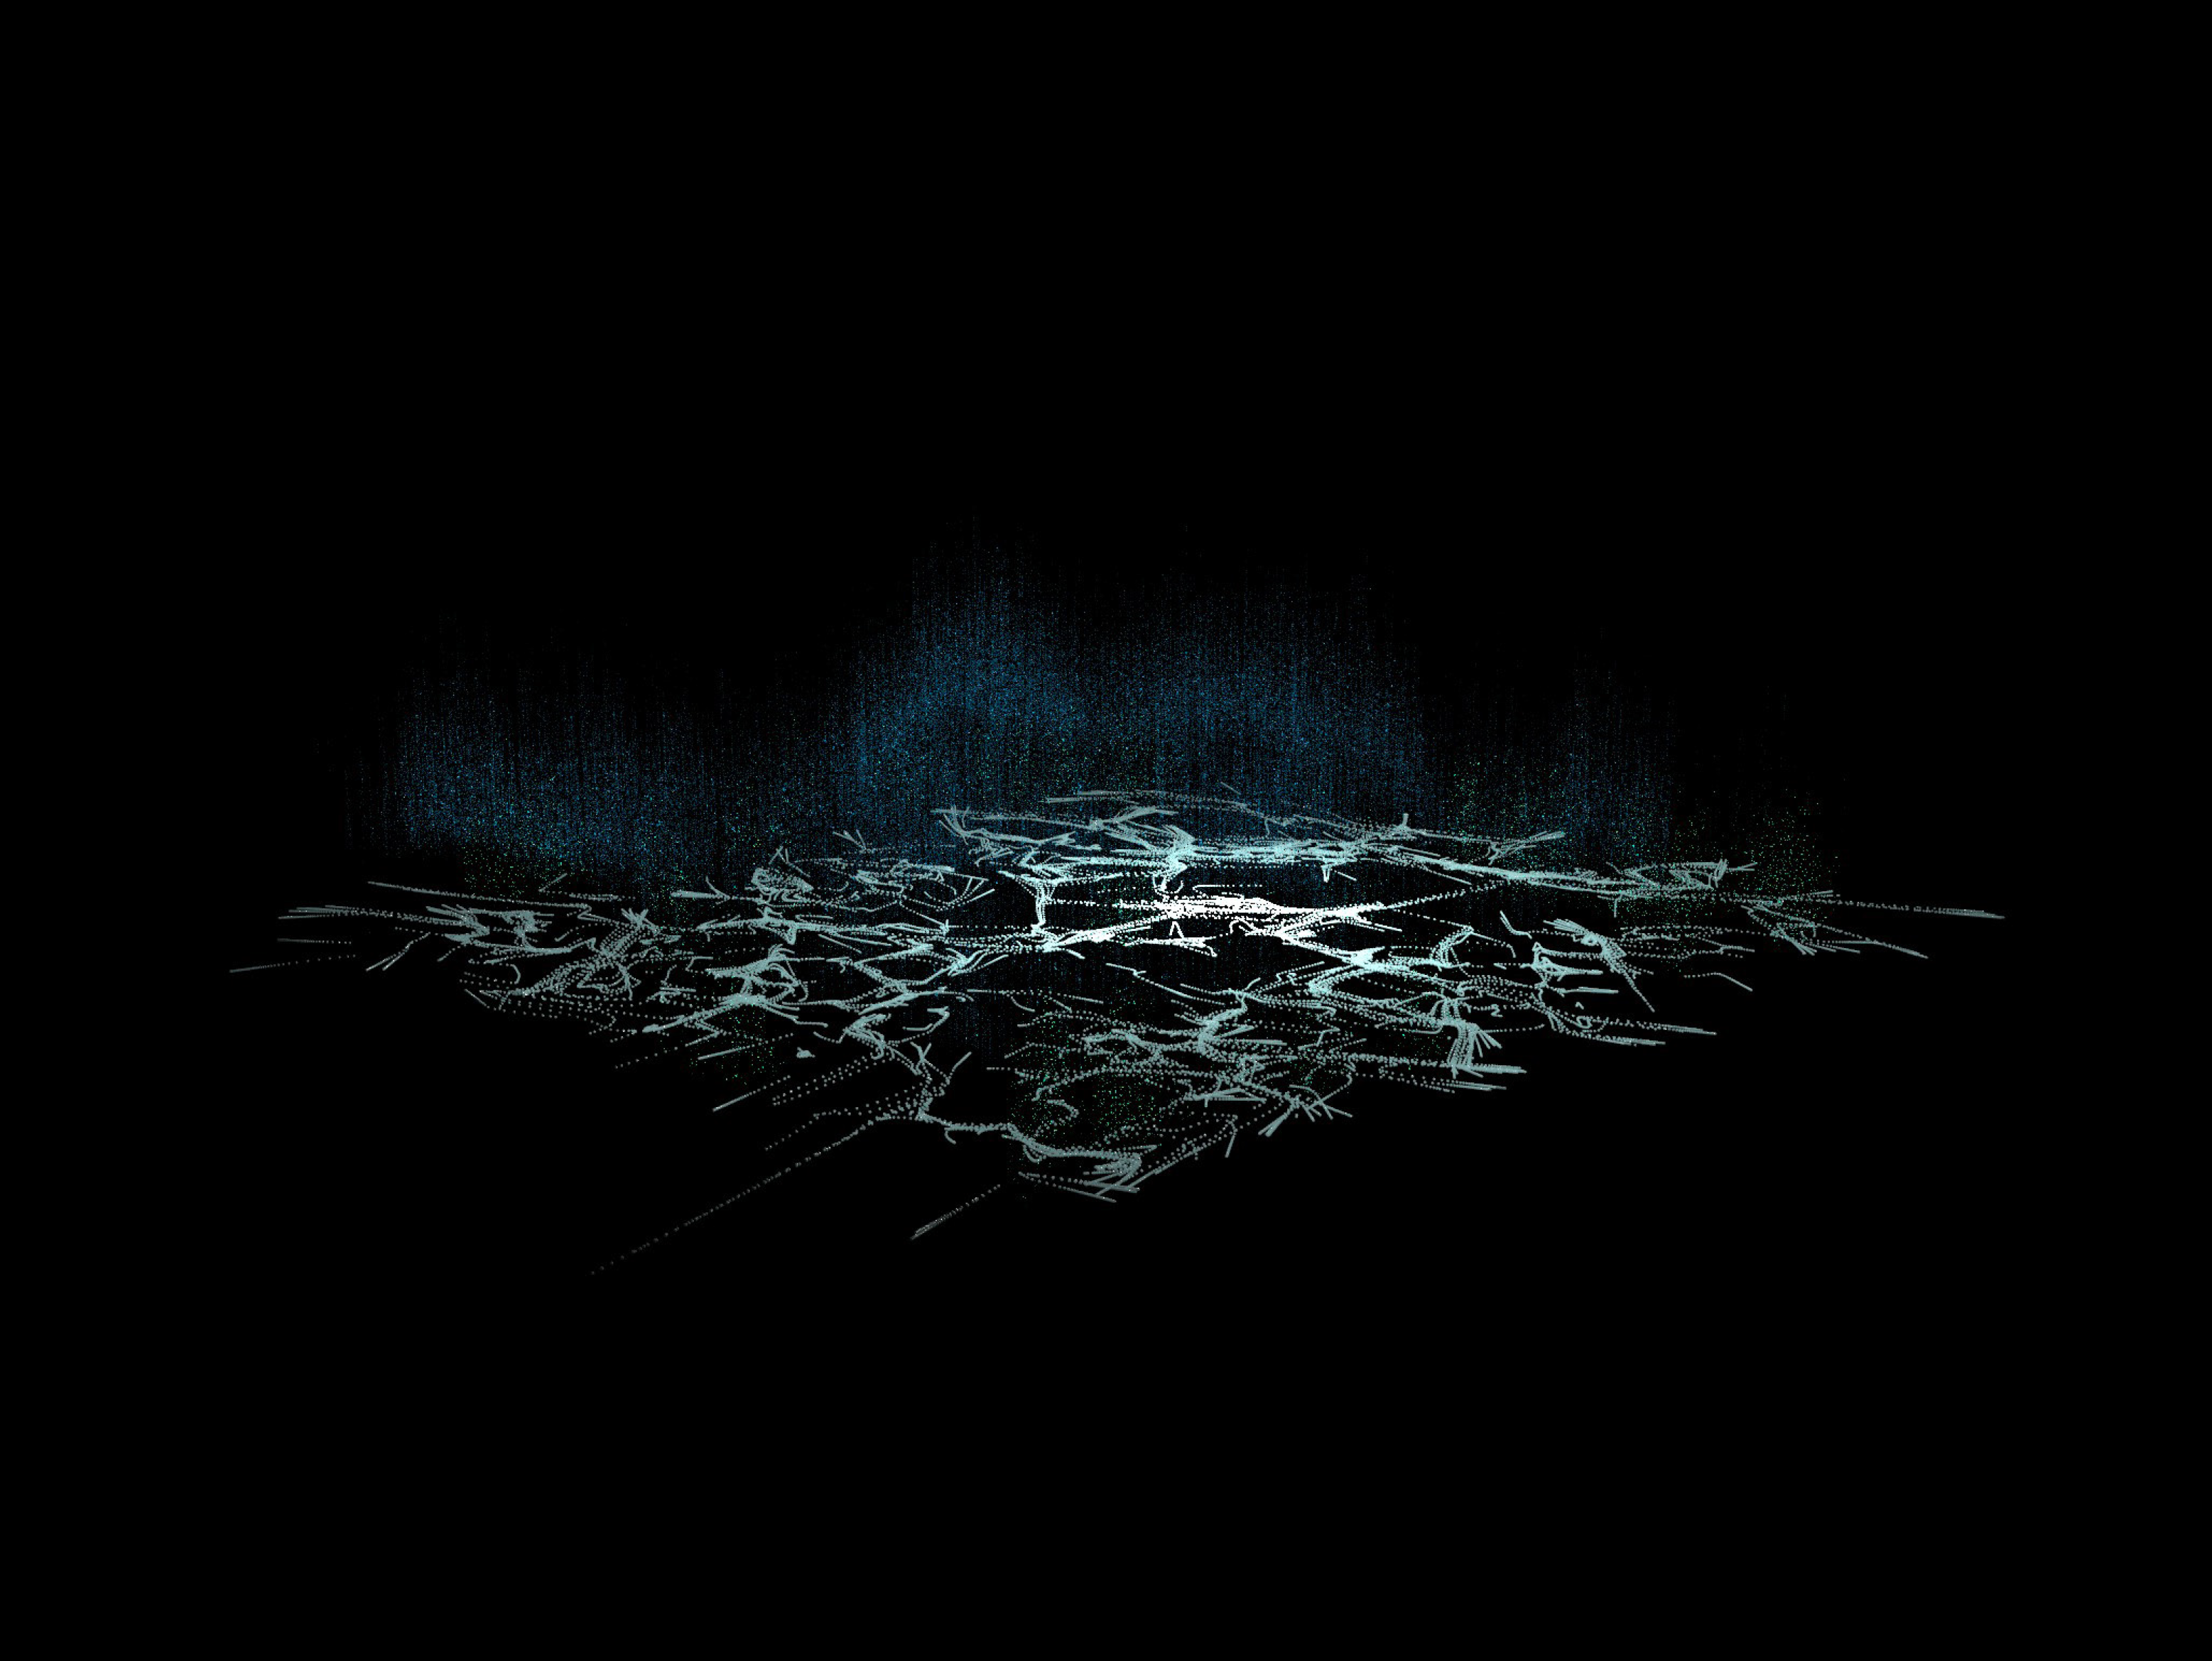
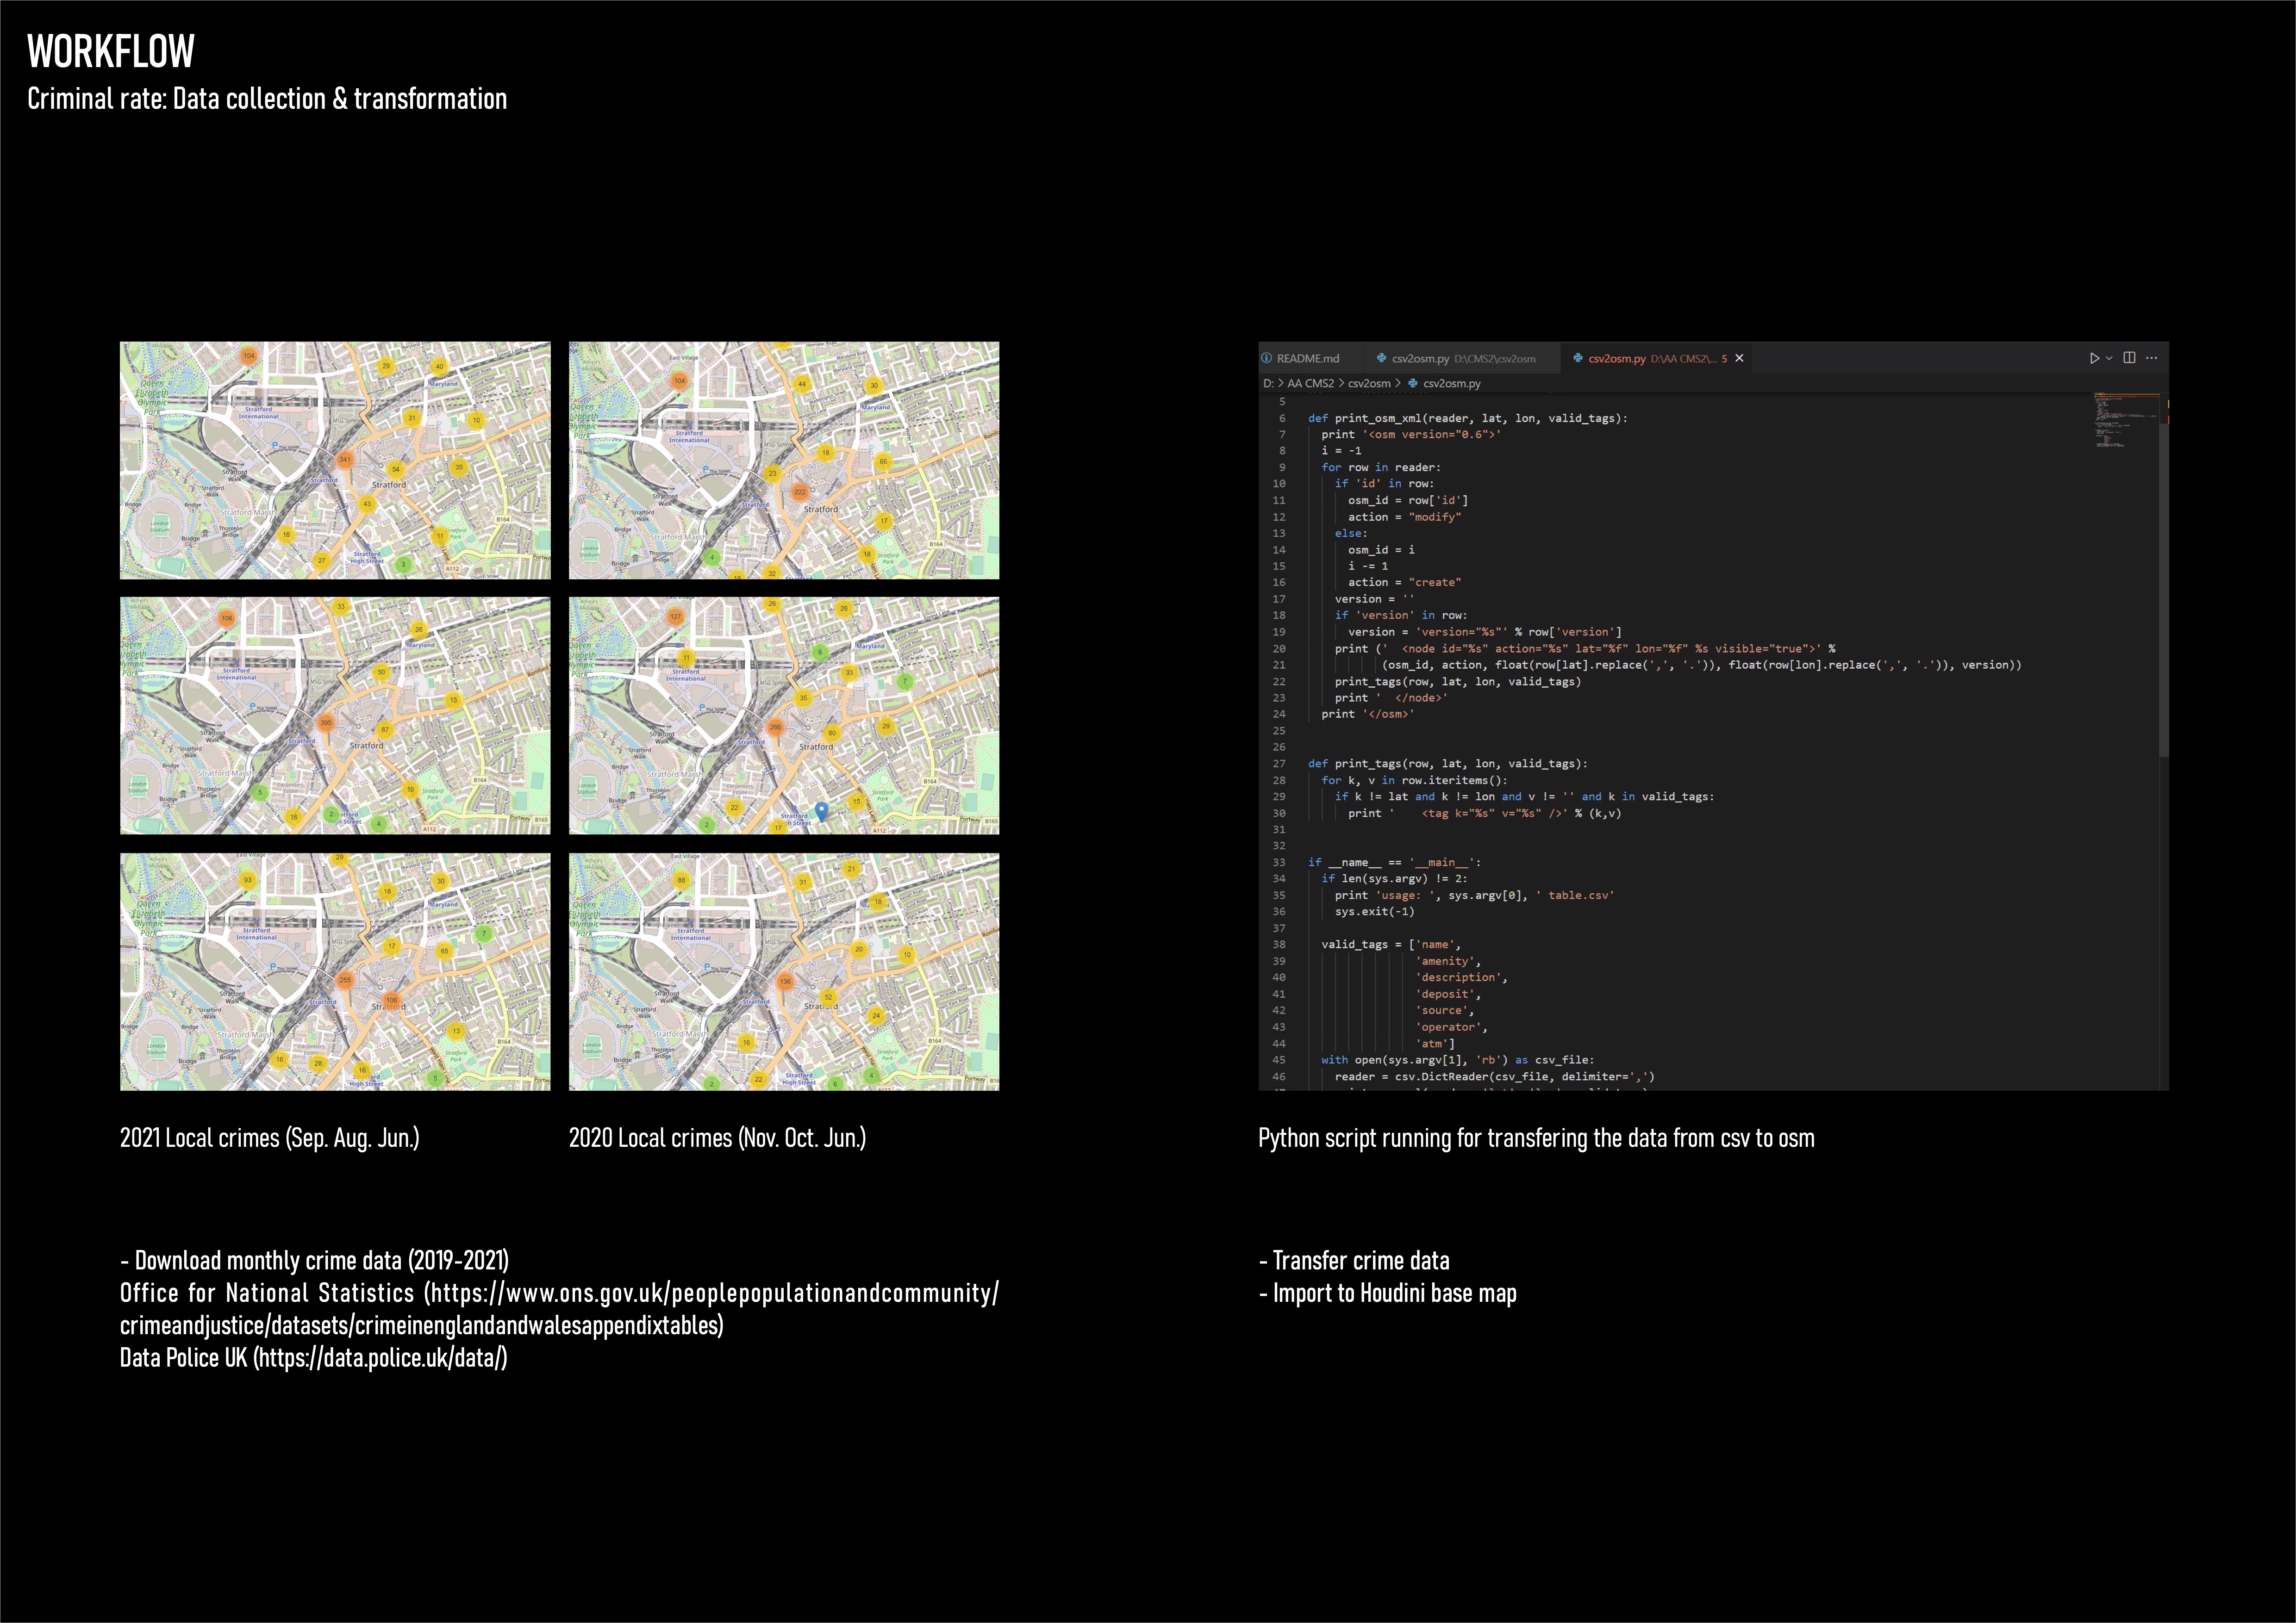
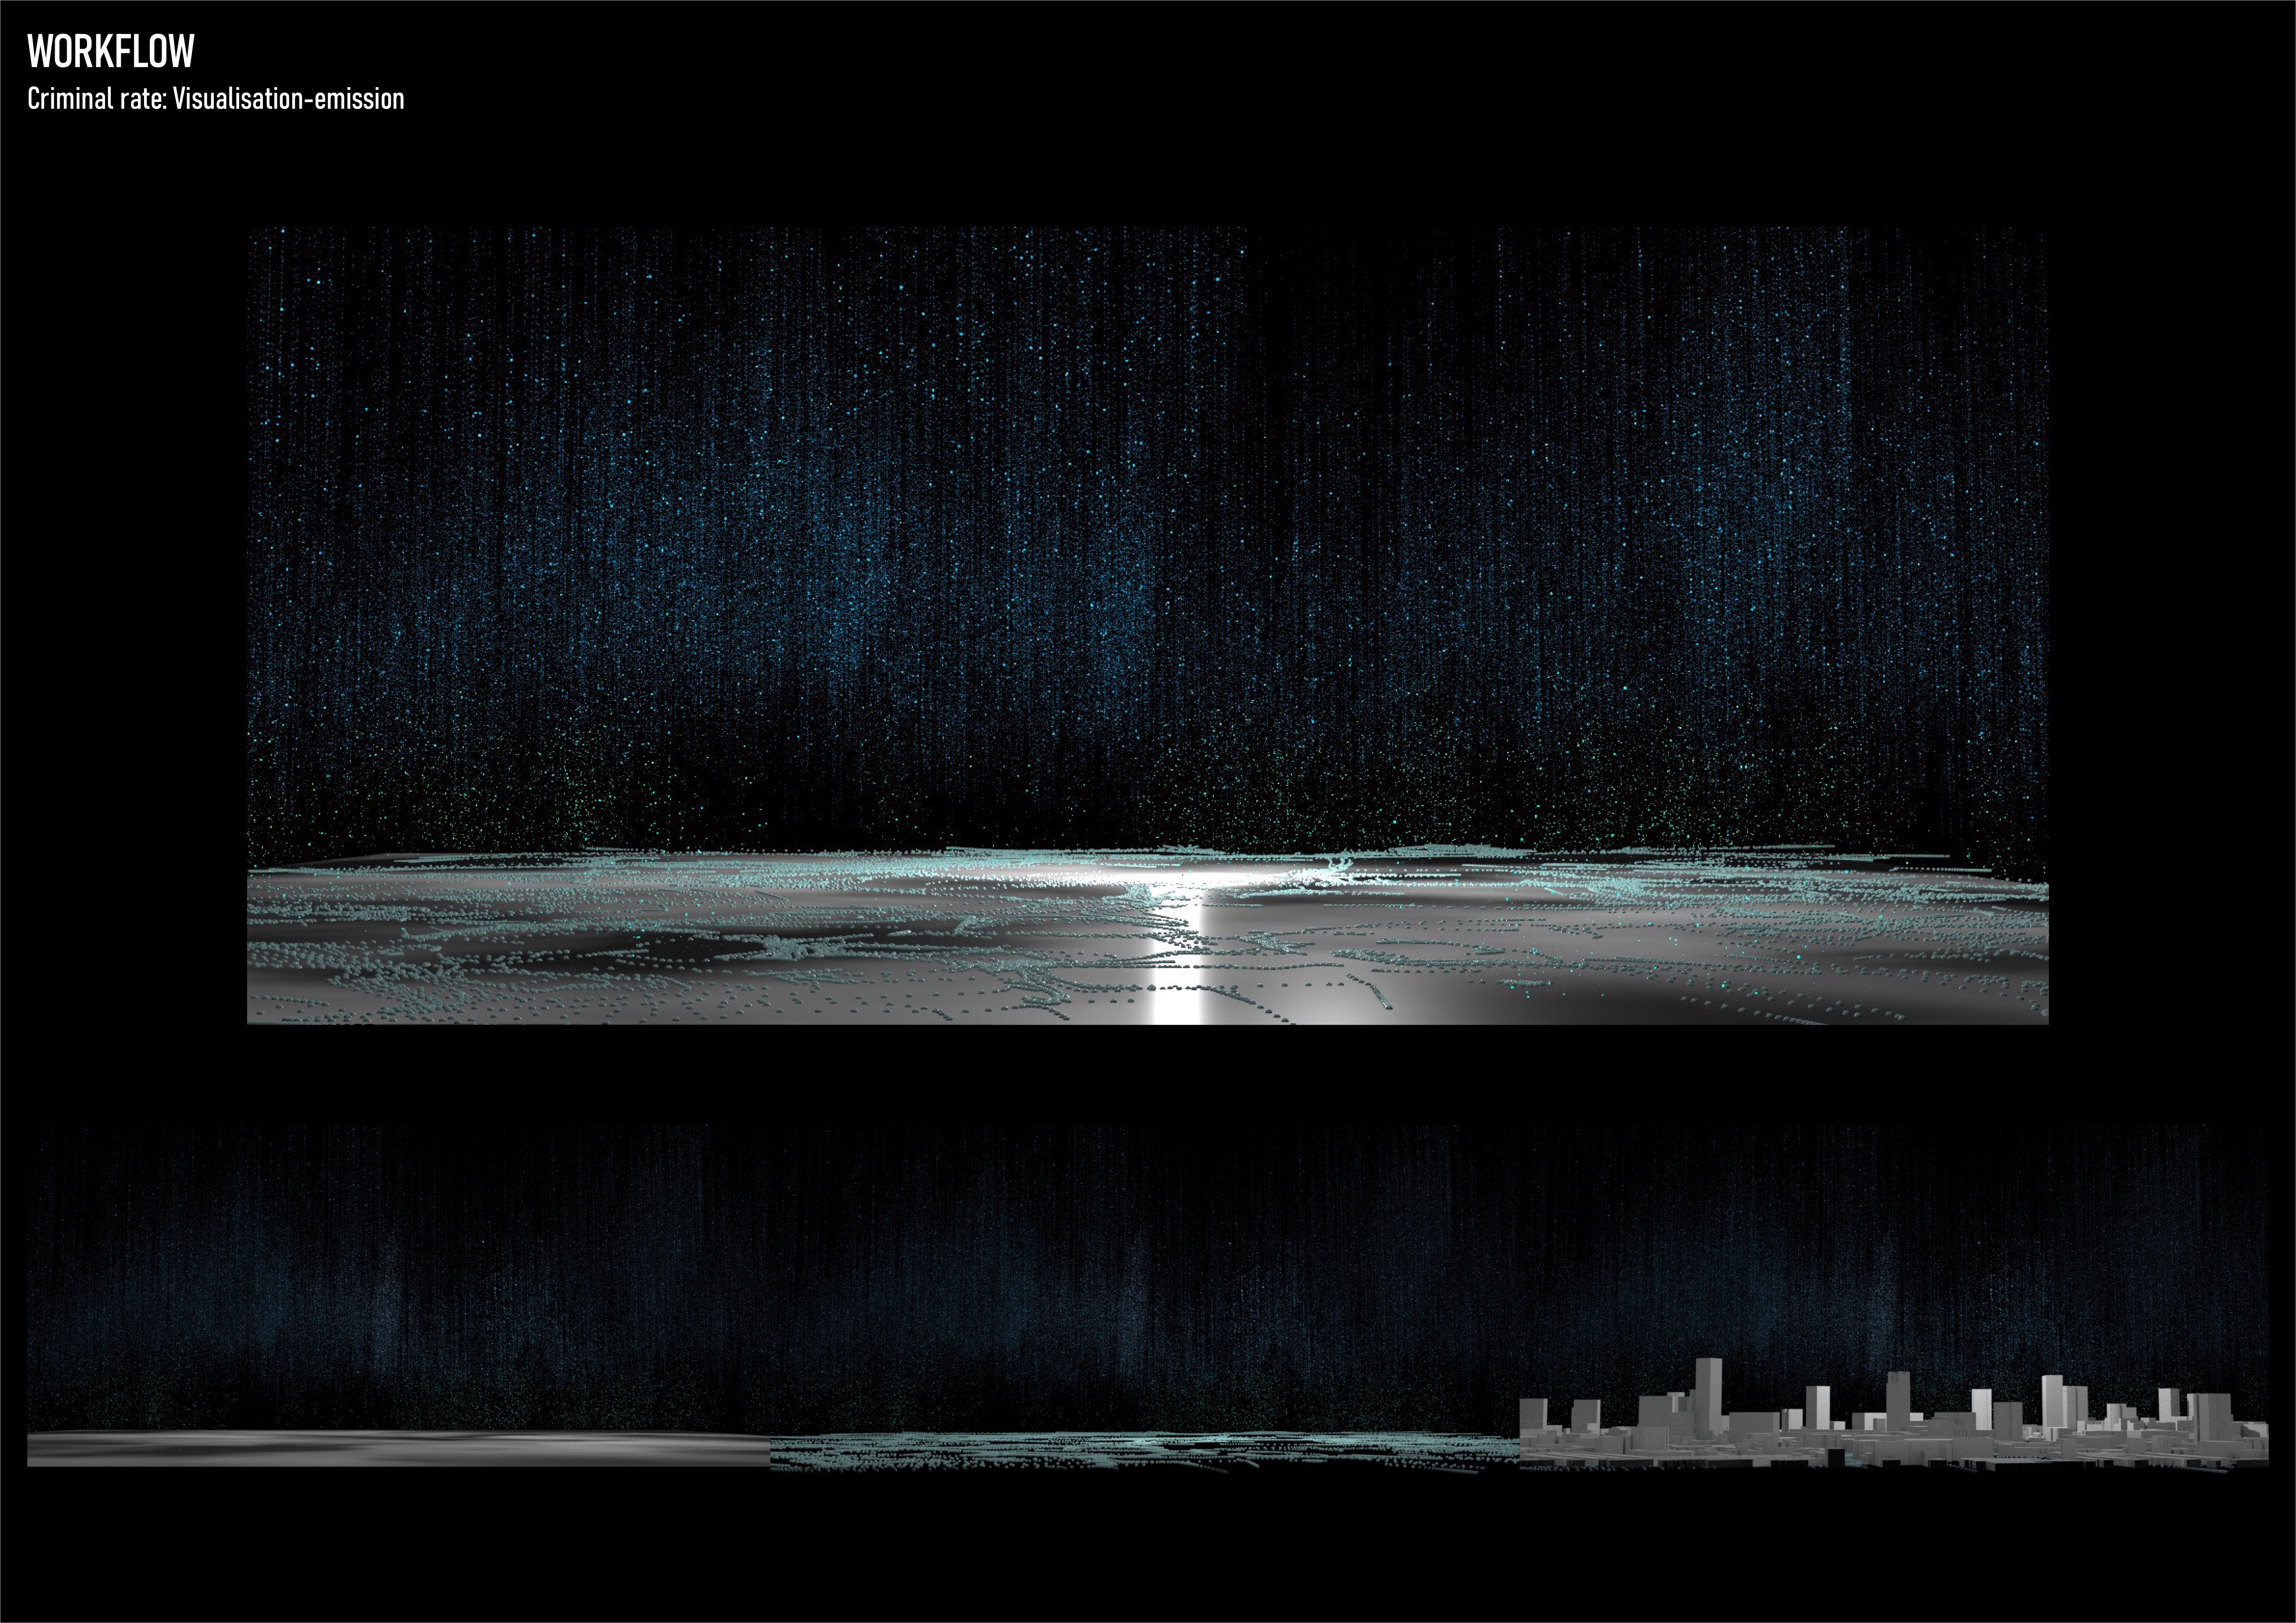
Based on how the ‘environment’ affects people’s behaviours, the project aimed to explore invisible relationships in between. The abstract digital landscape visualises how traffic flow and spatial order affect the crime rate in east London.


#2
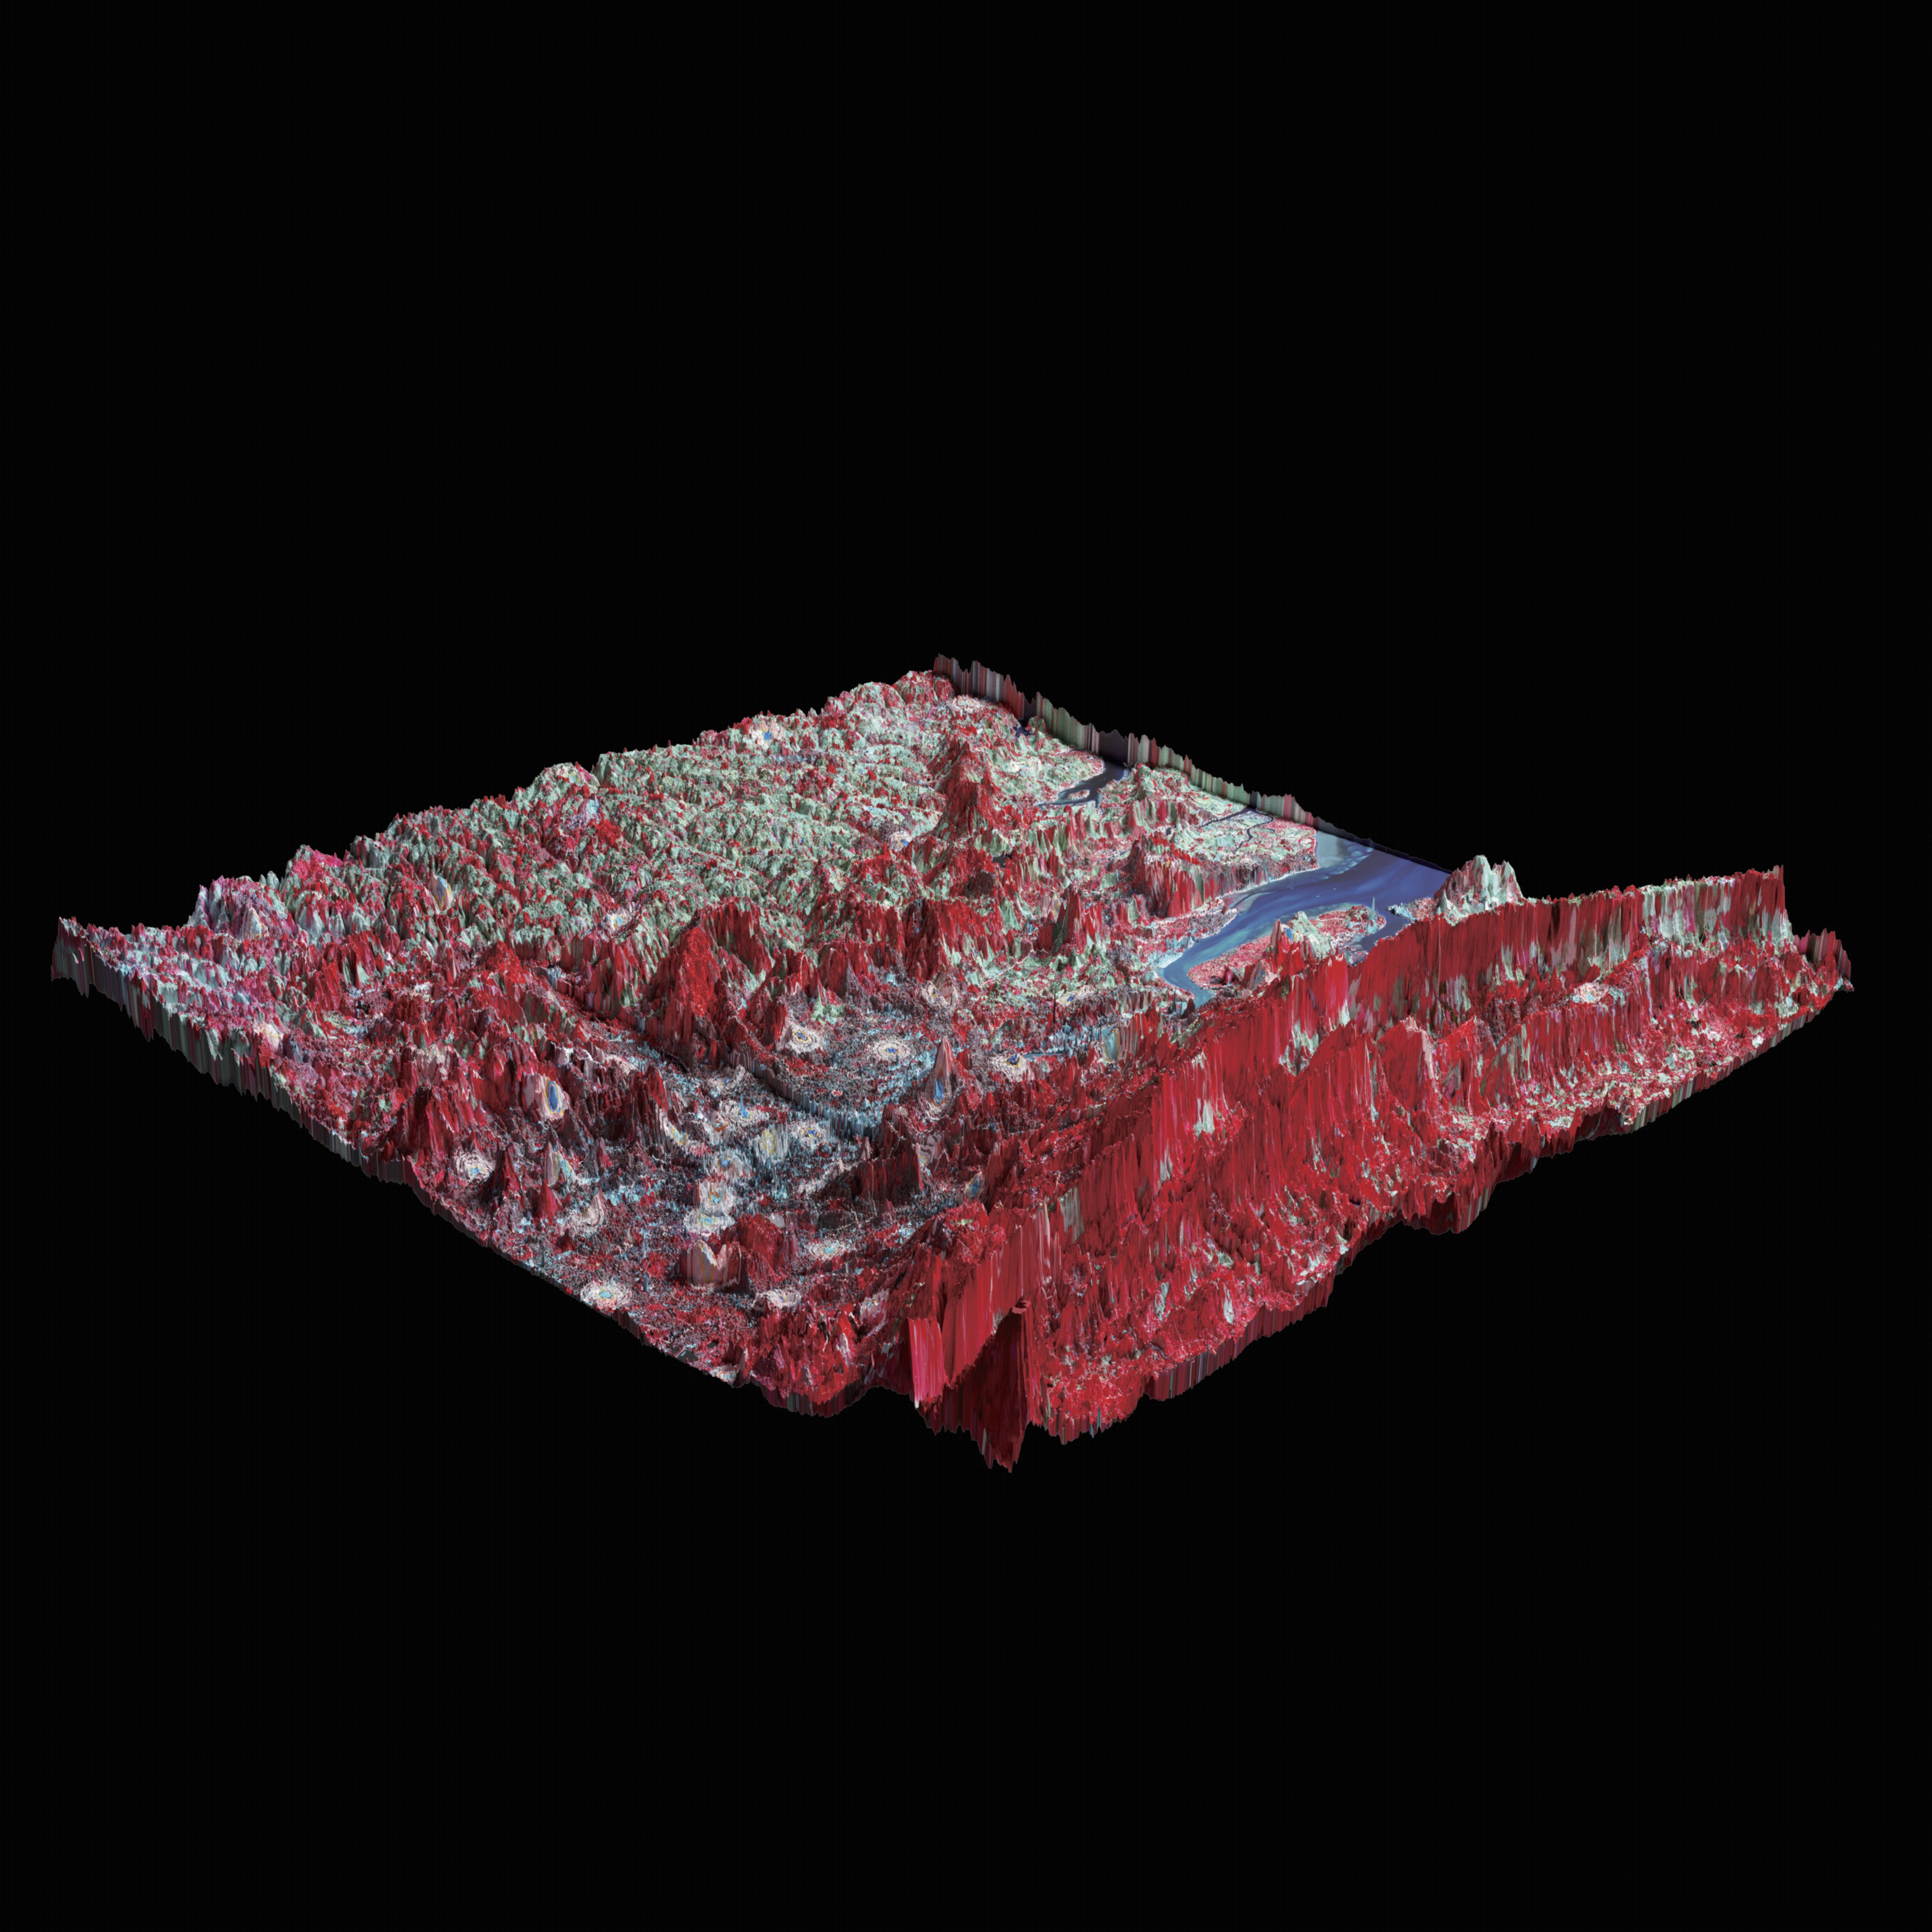
The project centred on Newham, one borough of London, often stigmatised in the stereotype of ‘east London’ and is currently under colossal change and new investments. Old buildings are being demolished, new land is being developed, and new residents and investors are being welcomed. Meanwhile, more and more local people are moving out of Newham. The project tried to explore the reasons behind this. Aside from that, it also aimed to show the urban sprawl around London and its affected human-environment relation and rethink the urban value system.
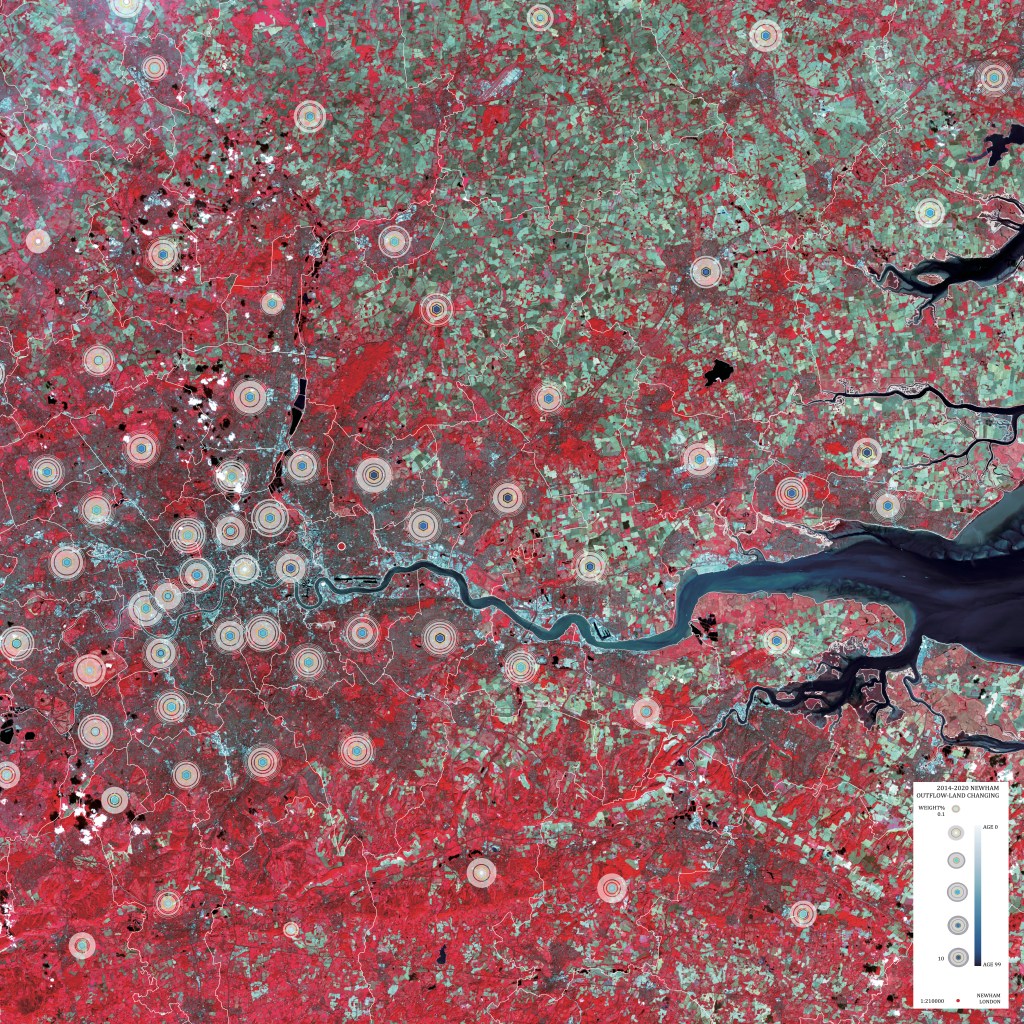
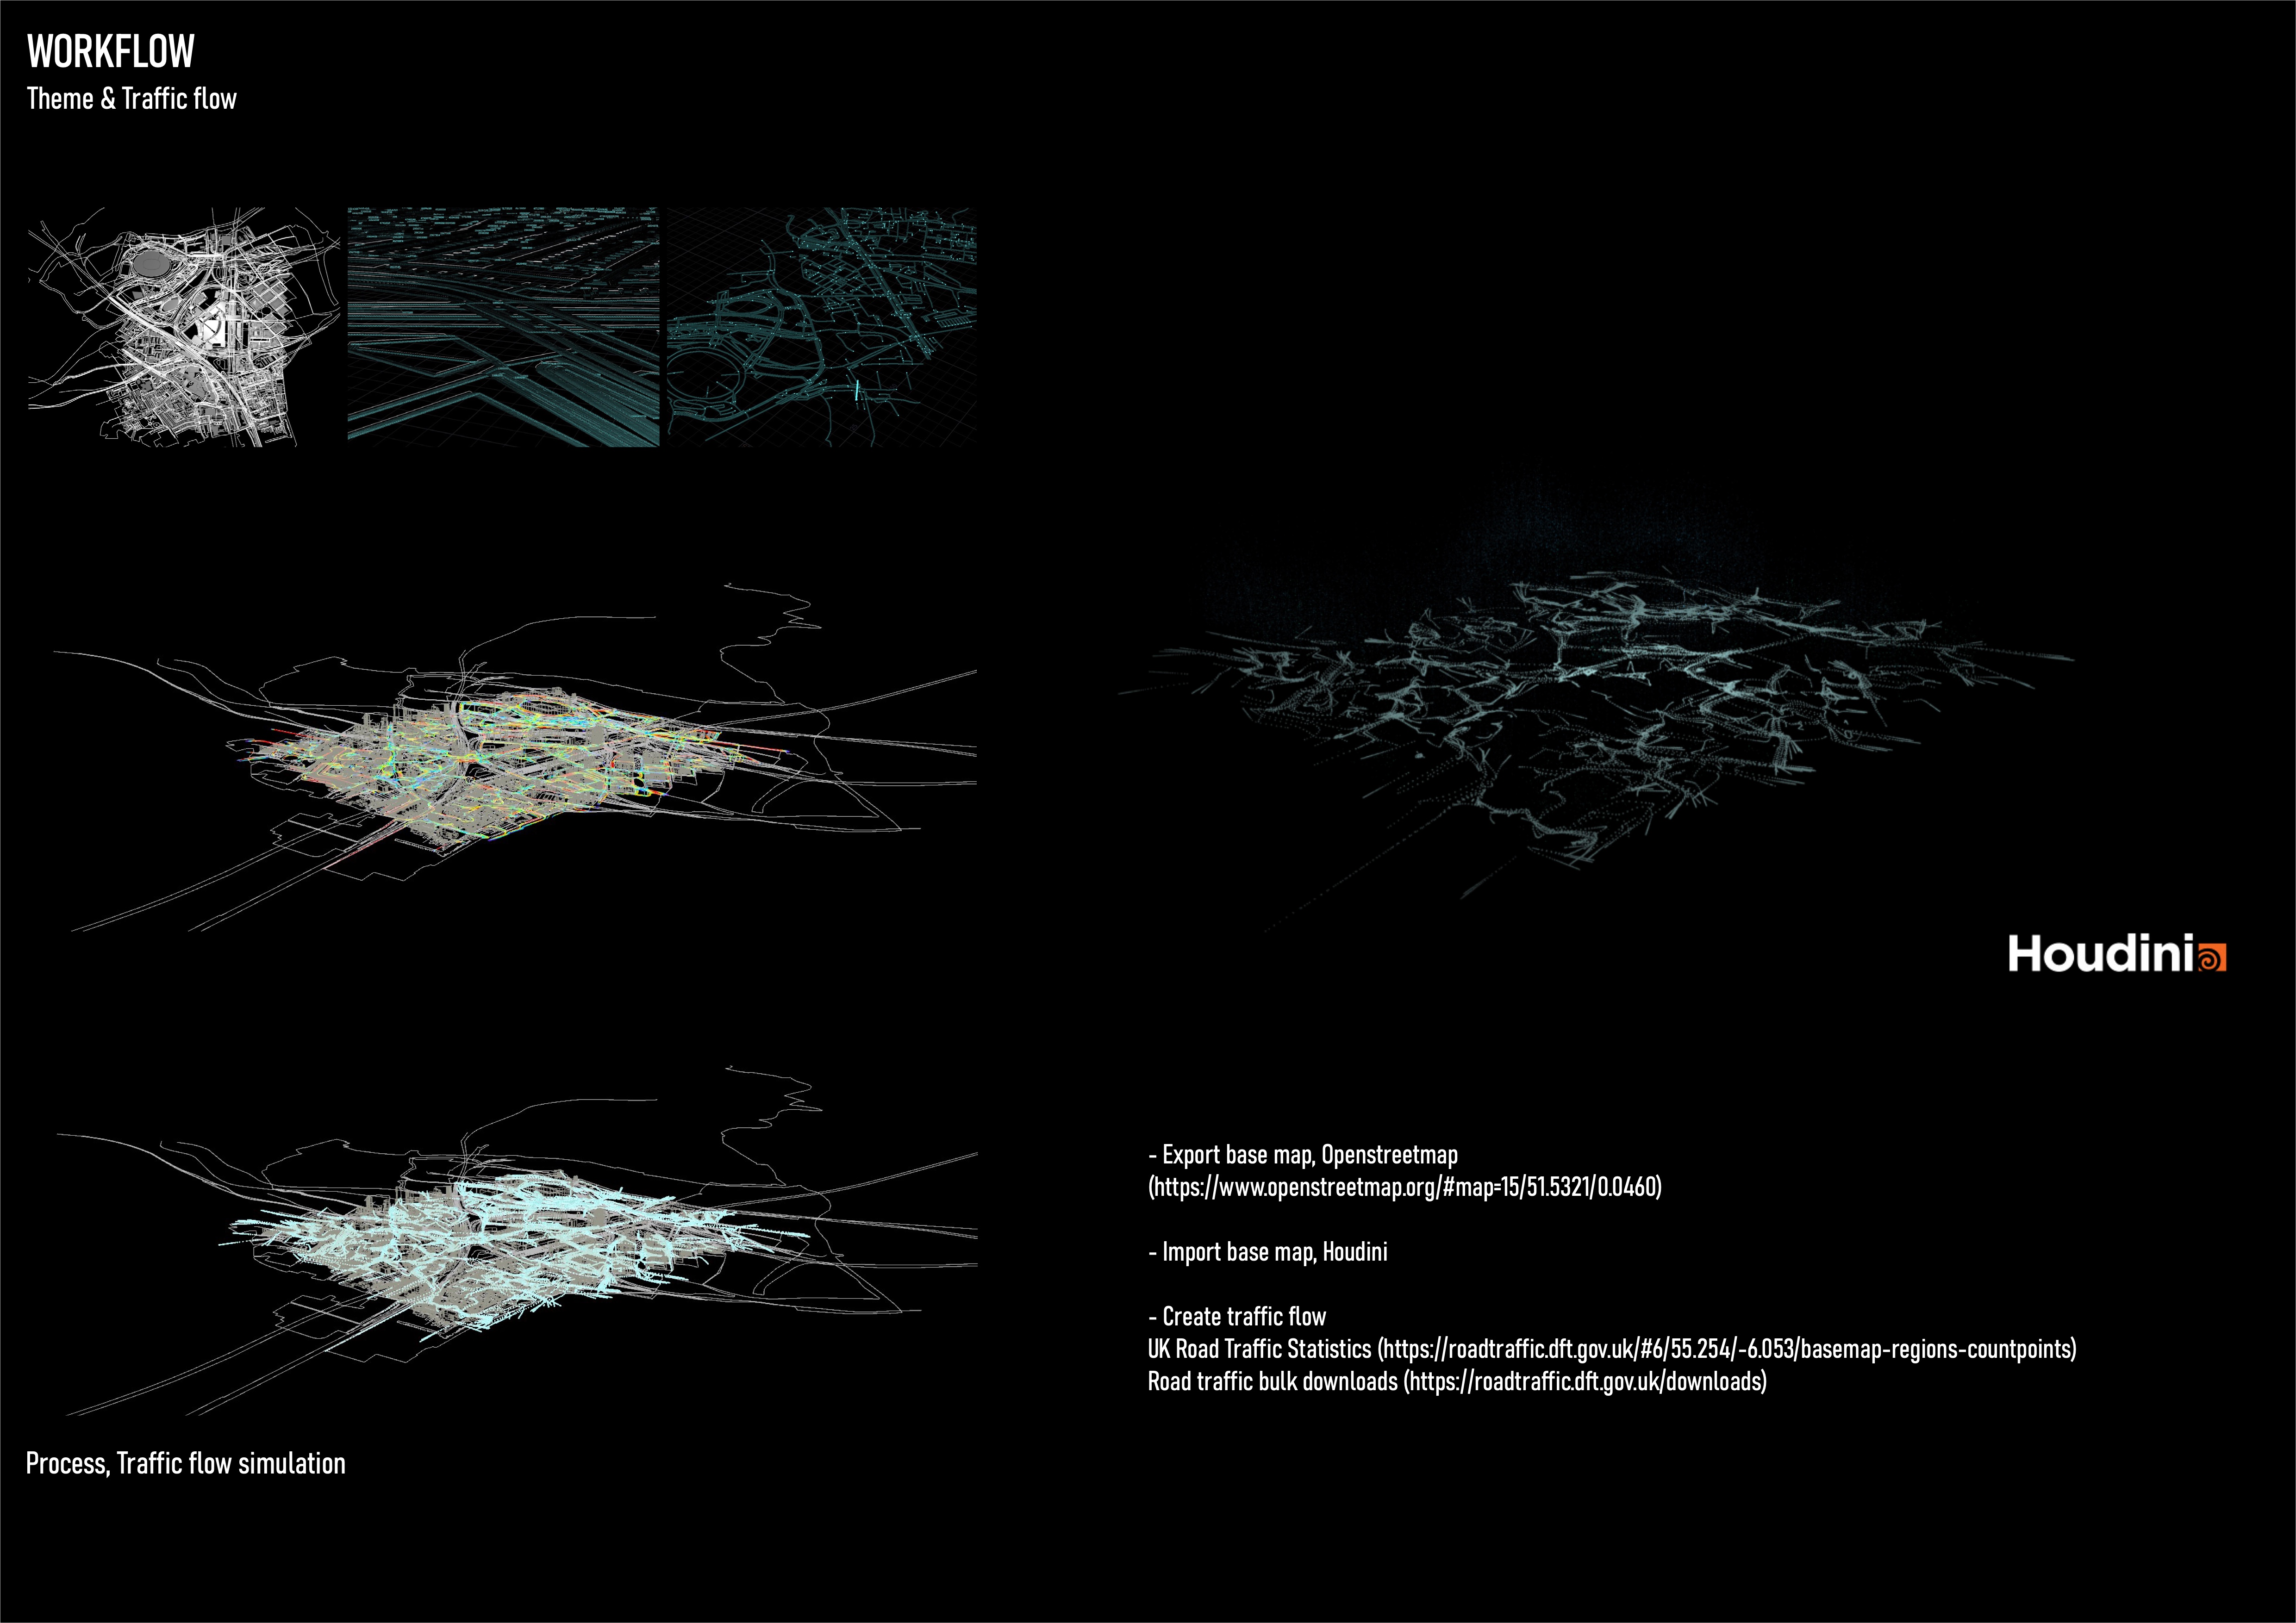
Based on land-use classification, the project analysed seven years of data to track landscape changes. Different colours represent different land use. For example, the red area represents ‘was under change’ with various actions. The second layer is the domestic migration flow from Newham. Gradual white circles (from small to large) represent the quantity percentage of migration during seven years. Incremental colour plates (from white to blue) represent the age groups (young to old).
To understand how the ‘river valley’ impacts the development of London (‘change’), the map exaggerated London’s topography and observed its effects.